How to read a retail footfall report
A landlord’s traffic numbers can help you price a unit, as long as you know how they were counted and turn them into sales you can test.
- Words
- Devin Oakes
- Filed
- Read
- 4 min
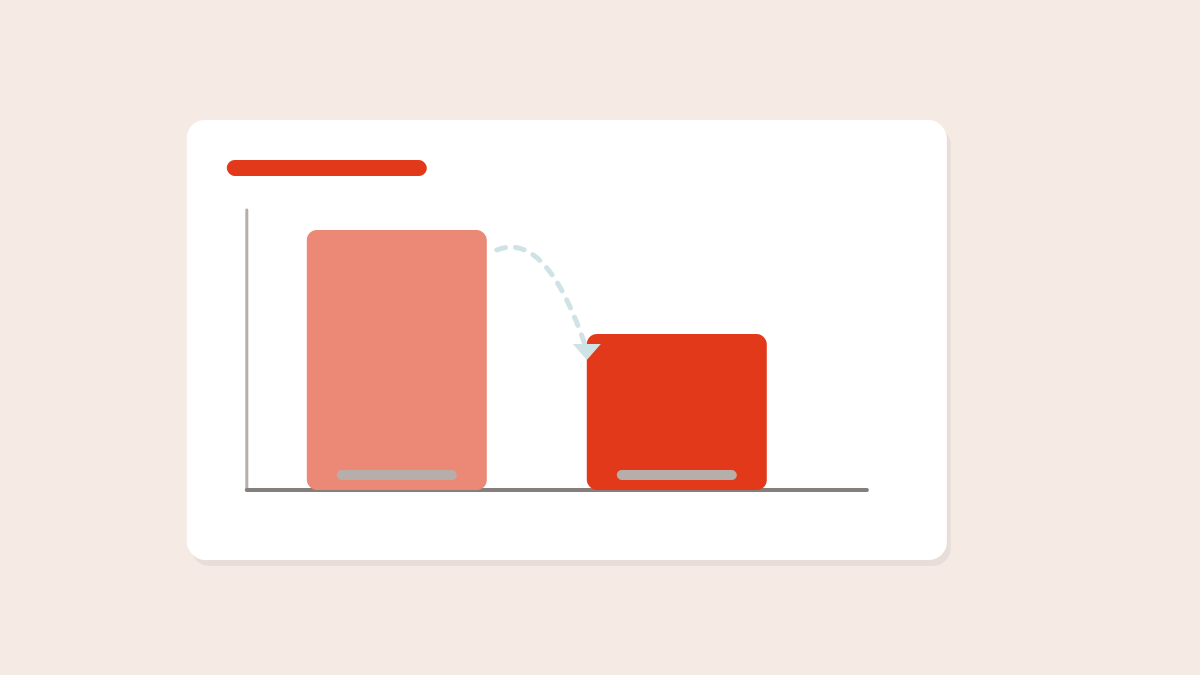
Sooner or later, a leasing agent for a shopping centre or busy retail strip will hand you a footfall report. It will have a big number on the front, a chart that goes up and to the right in December, and a promise that the unit you are looking at sits in the middle of it all. The report can be genuinely useful. It can also be read in a way that makes a weak location look strong. Here is how to read it like a tenant.
Know what was counted
Footfall, or foot traffic, is a count of people passing a point or entering a place. How it is measured varies. Door counters at entrances record people coming in. Camera-based sensors can count people passing along a corridor. Some reports use estimates based on anonymised mobile location data, which can show patterns but is modelled rather than counted directly. Each method has blind spots, and the same centre can produce different totals depending on which one is used.
Ask four questions. Which method was used? Where are the counters, and is there one near your unit? Does the total count visits or people, since one person entering twice may be two visits? And over what period: a single strong month, or a full year?
Find the traffic at your door
A centre with a million annual visits can still have a quiet corridor. Traffic concentrates near anchor tenants, food courts, transit entrances and parking. Ask for counts by entrance or zone, and ask the agent to show you which counters are closest to the unit. On a street, the equivalent question is which side gets more people and which end of the block they come from.
Then look at the shape of the data, not just its size. Weekday versus weekend, morning versus evening, and seasonal swings all matter. A gift shop can live with a quiet February if December is strong. A lunch counter cannot live with weekday traffic that disappears after two in the afternoon.
The big number on the front of a footfall report belongs to the centre. The only number that belongs to you is the one walking past your door.
Turn traffic into a sales estimate
Footfall only matters if you can connect it to sales. Two ratios do most of the work. Capture rate is the share of passing people who enter your store. Conversion rate is the share of visitors who buy something. Neither is a fixed figure; both depend on your category, your frontage and how good you are at retail. If you already run a store, your own history is the best source. If not, be conservative.
-
Start with the relevant traffic
Illustrative example: a centre reports 120,000 visits a month, and the zone around the unit accounts for about 30 per cent, so roughly 36,000 visits pass by.
-
Apply a capture rate
If 4 per cent of passers-by come in, that is about 1,440 store visits a month.
-
Apply a conversion rate
If a quarter of visitors buy, that is about 360 transactions a month.
-
Multiply by your average sale
At an average transaction of $40, estimated sales come to about $14,400 a month, or roughly $173,000 a year.
-
Test the result against your costs
Divide your total occupancy cost by estimated sales. For a 1,200-square-foot unit at $30 base rent plus $20 additional rent per foot, occupancy costs are $60,000 a year, about 35 per cent of the estimated sales, which would be a heavy load for most small retailers.
Run the calculation with a cautious case and an optimistic case. If the deal only works in the optimistic one, you have learned something important before signing. What share of sales a business can afford to spend on occupancy depends on its margins, so work that number out with your accountant rather than relying on a rule of thumb.
Watch for flattering comparisons
Growth figures need context. A year-over-year increase looks impressive if last year included a renovation, a closed entrance or an unusual event. Moving holidays, such as Easter, can shift traffic between months. A report that compares this December with last March is not comparing like with like. Ask for the same period year over year, and for a note on anything unusual that affected either year.
Be wary, too, of numbers tied to a single event or anchor. If a large tenant drives much of the traffic, ask about the anchor’s lease term. Some retail leases include co-tenancy clauses that adjust rent if key tenants leave; whether you can get one depends on your bargaining power, and your lawyer can advise on how they work.
Check it with your own eyes
No report replaces standing outside the unit. Spend an hour at the times that matter to your business, on a weekday and a weekend, and count with a tally app or a notebook. Note who passes, not just how many: commuters rushing to a train behave differently from families browsing on a Saturday. If your count is far below the report, ask why before you go further.
Put it in the negotiation
If your own counts or the zone data show the unit sits in a quieter part of the centre, raise it. It is a fair basis for asking for lower rent, more free rent, a larger allowance or a shorter first term. Have a commercial leasing lawyer review any clauses that tie rent to sales or to other tenants.
Keep reading
All stories ↗ The shop that moved three doors down A short move on the same street still meant two leases, one overlap month and a long list of things that had nothing to do with boxes. By June Whitaker — 5 min
 The pop-up that signed a five-year lease A candle maker went from a three-month holiday stall to a long-term storefront, and the leap was mostly about paperwork. By Devin Oakes — 4 min
 Tenant rep broker fees: who pays and how much The landlord usually writes the check, but the commission is built into your rent. Here is how it is calculated and what to put in writing. By Omar Saleh — 7 min
 Next in the index — 11 / 19 Fit-out — 4 min
Make good: the bill that arrives when you leave



The Monday memo · free
Subscribe for the Monday memo
One long read, three clauses worth knowing and a note on the market, every Monday morning.
( Tap to say yes )